Introducing Azure ML
Who Am I? What Am I Doing Here?
| Catallaxy Services |  @feaselkl |
|
 |
Curated SQL | |
 |
We Speak Linux |
What Is Azure ML?
Azure Machine Learning is a Software as a Service offering on the Microsoft Azure network. It offers a point-and-click interface for building, training, testing, and using machine learning models.
Once you have a model created, you can easily turn it into a web service.
Why Use Azure ML?
Azure ML has several features which make it a great choice for data scientists:
- Drag-and-drop interface is easy for anybody familiar with SQL Server Integration Services or Informatica.
- Dozens of built-in models, including clustering, regression, and classification models.
- Support for additional models via Python and R scripts.
- You pay for model processing time and web service access calls.
Azure ML gives you a straightforward way of loading and cleansing data, building training versus test data sets, training models, scoring models, and publishing models as production-ready web services.
Goals
- Become more familiar with the Azure ML interface.
- Build simple models using sample and custom data sets.
- Build web services to consume model results.
- Analyze slightly complex models and compare model efficacy.
Azure ML Steps
- Flight Delay Experiment
- Uploading A Data Set
- SQL Saturday Experiment
- SQL Saturday Web Service
- Titanic Survivors
Flight Delay Experiment
The Problem Description
Microsoft provides a sample data set called Flight Delays Data. We want to see if we can predict delays based on the data available.
Flight Delay Experiment
Basic Steps
- Grab the data set
- Filter out rows we don't want (cancelled flights)
- Filter out columns we don't want
- Split data into training and test data sets
- Train a linear regression model
- Score and evaluate the linear regression model
Flight Delay Experiment
Flight Delay Experiment
Demo Time
Scroll down for image-heavy demo.
Flight Delay Experiment
Create a new Blank Experiment.
![]()
Flight Delay Experiment
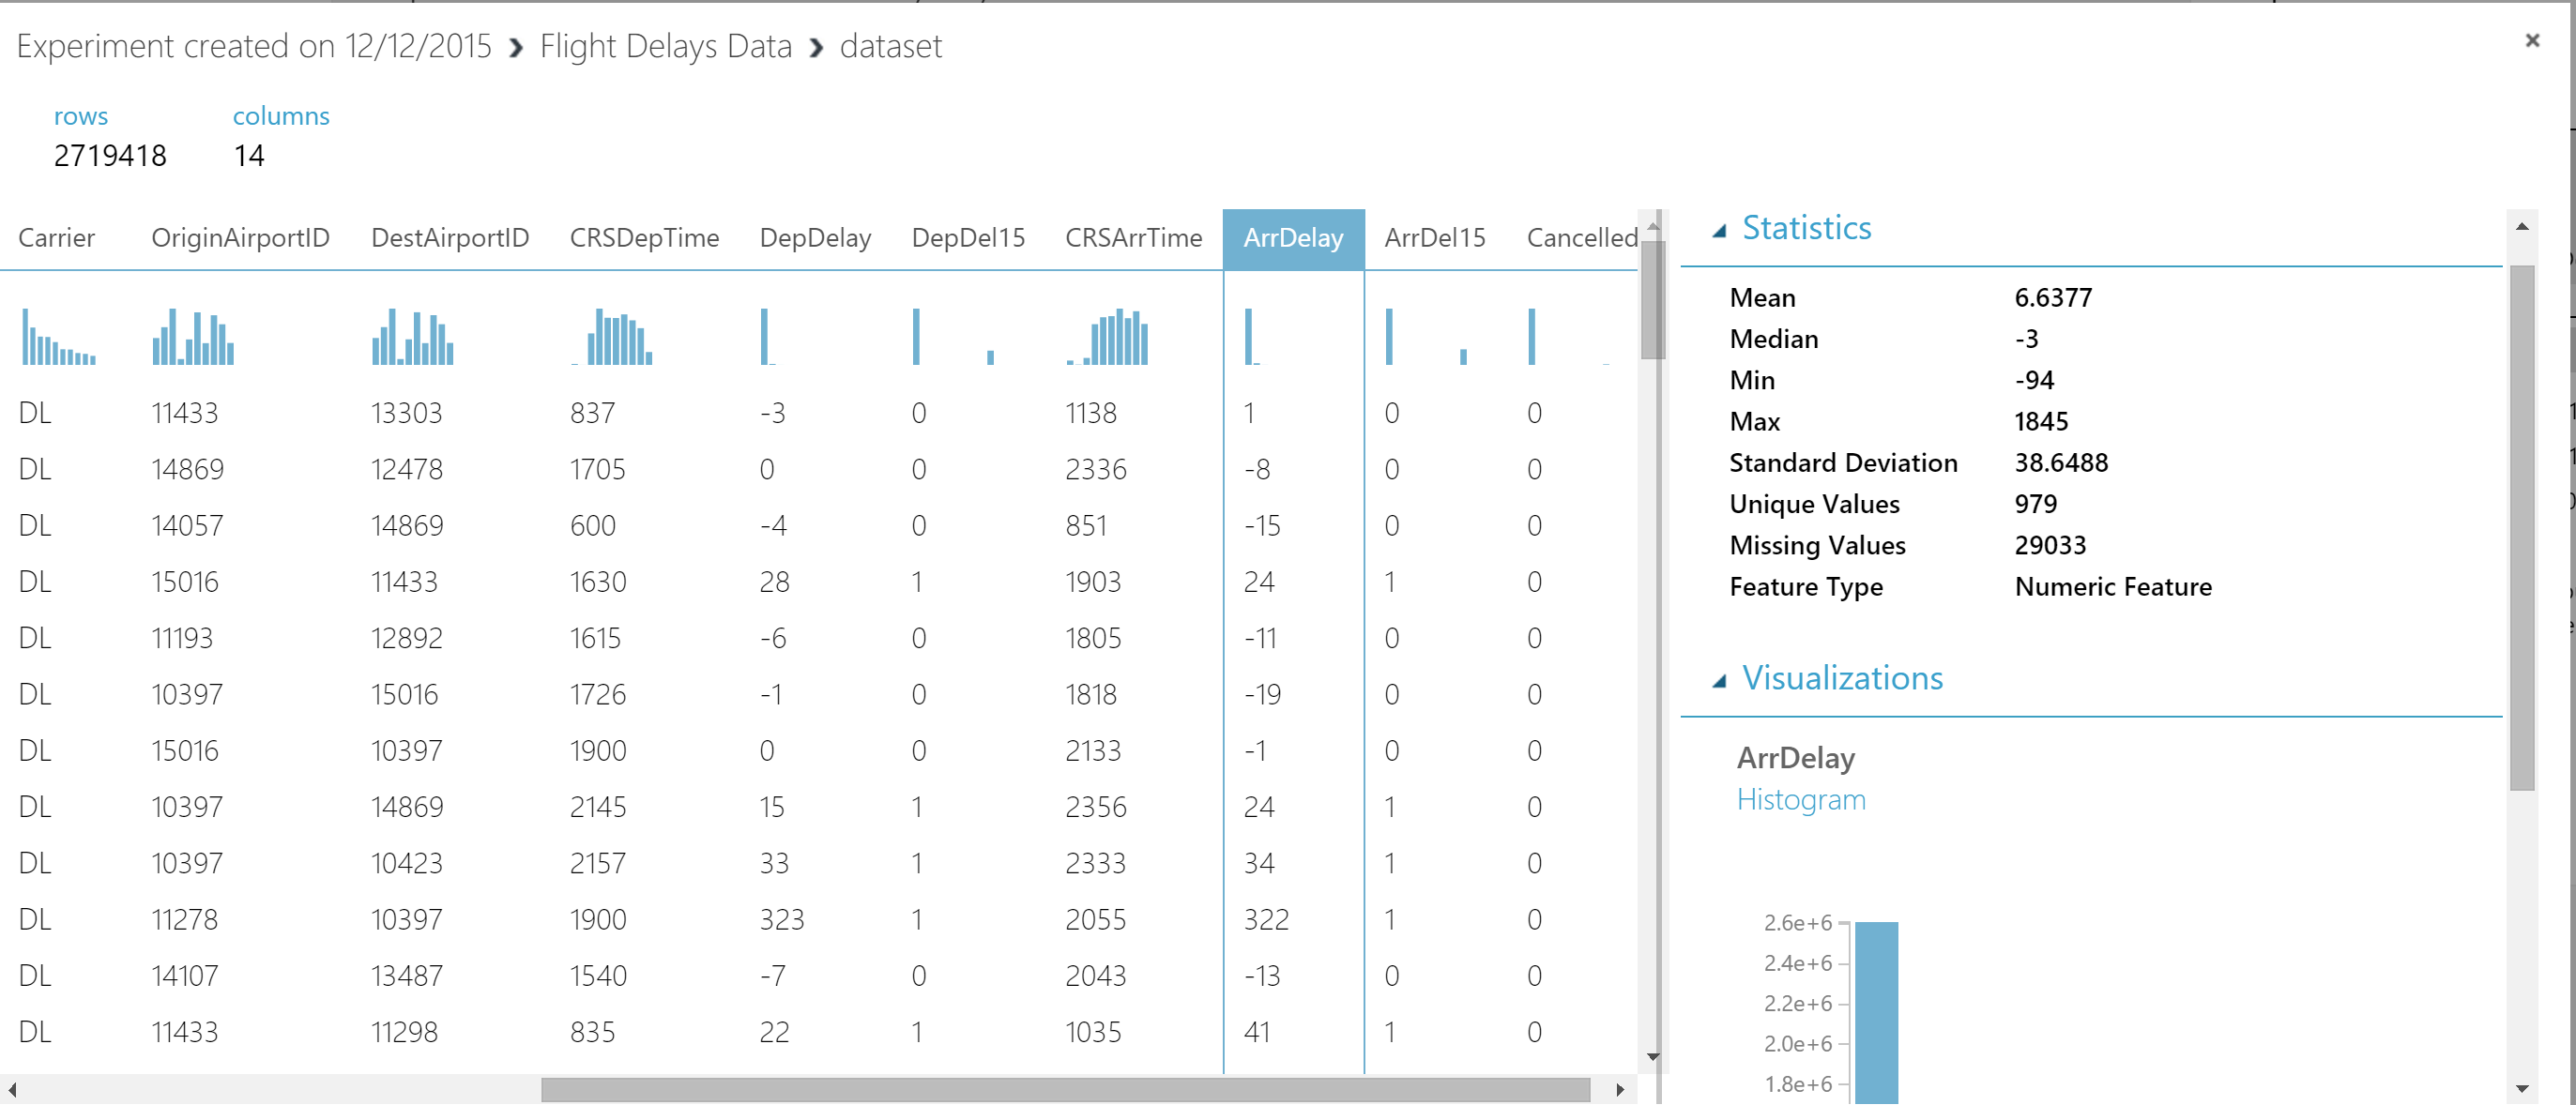
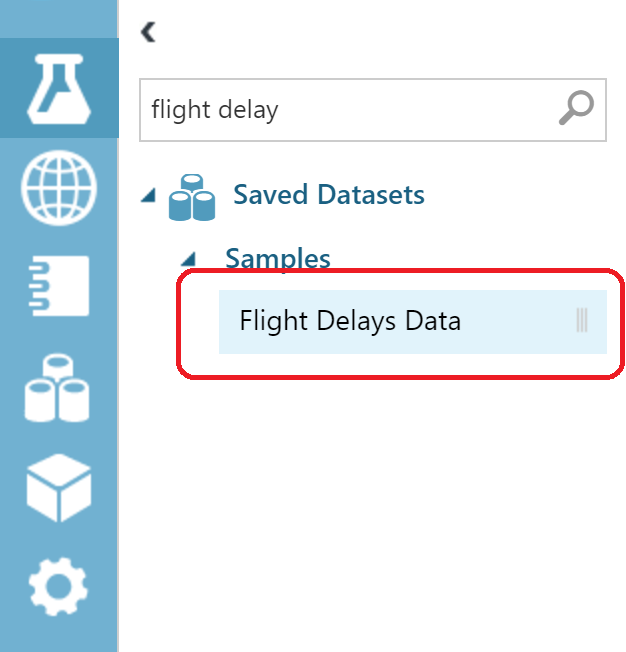
Get the Flight Delays Data.
Flight Delay Experiment
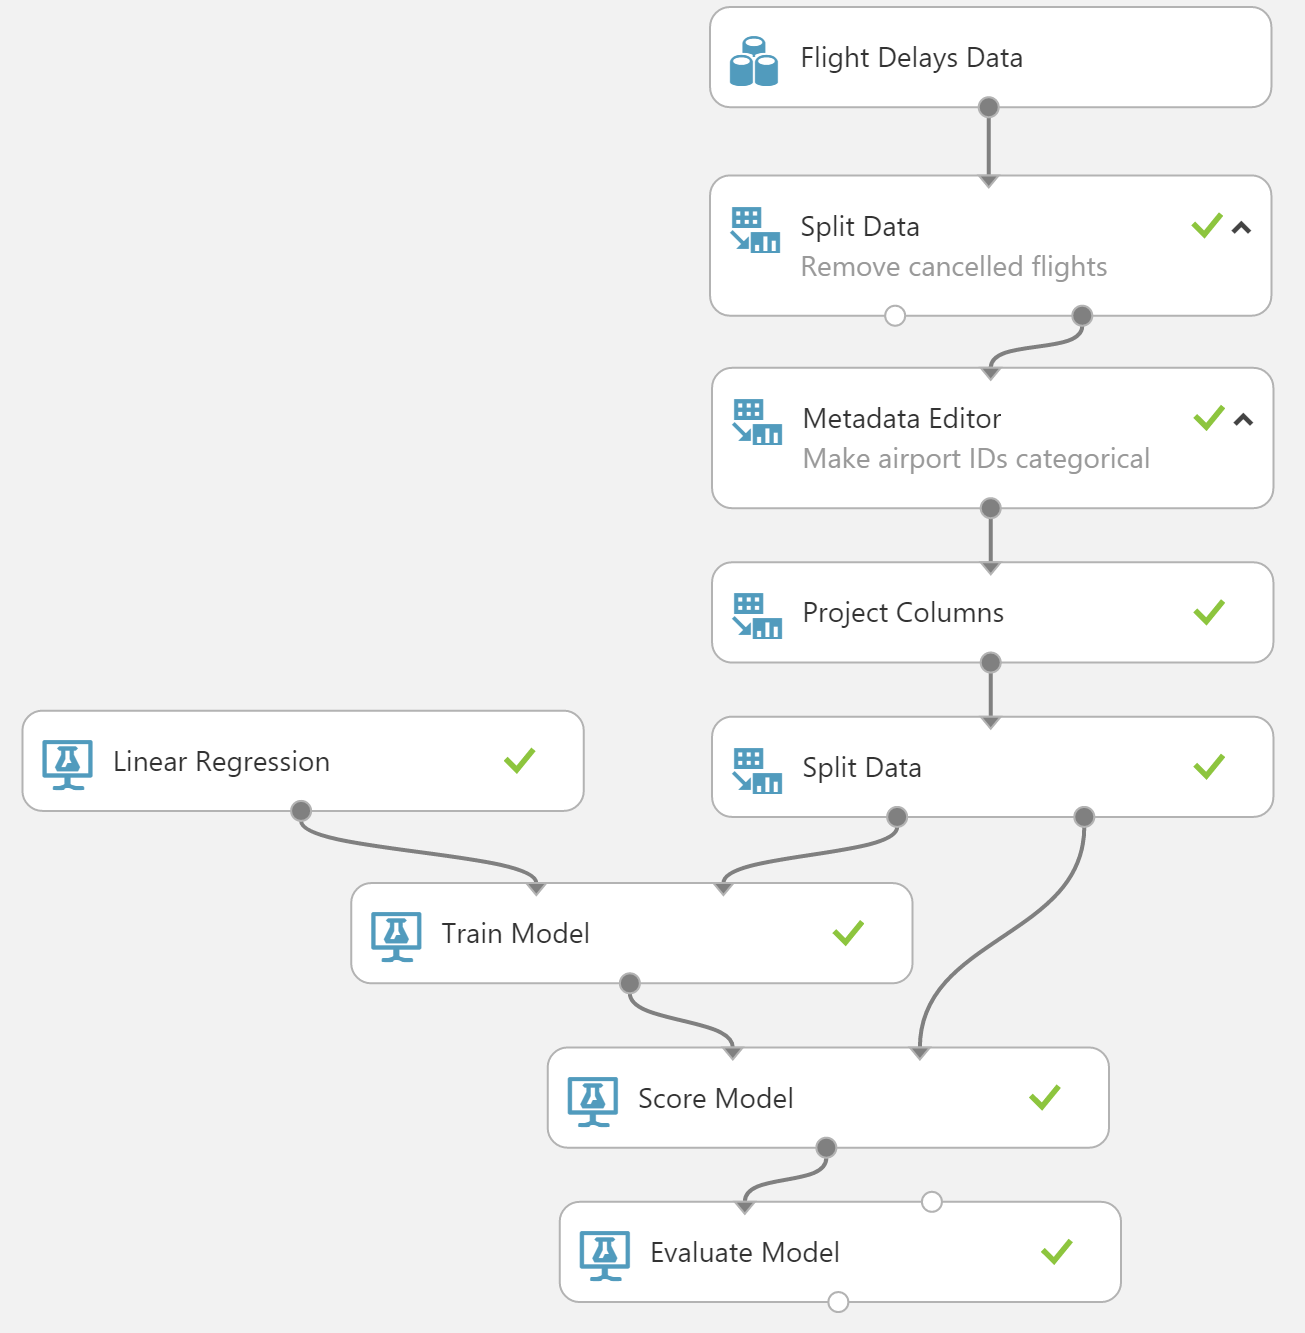
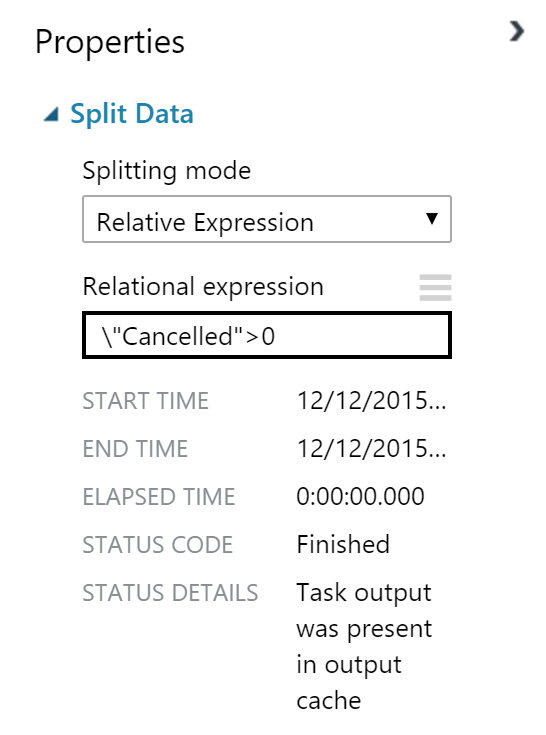
Ignore cancelled flights -- use a Split Data component.
Flight Delay Experiment
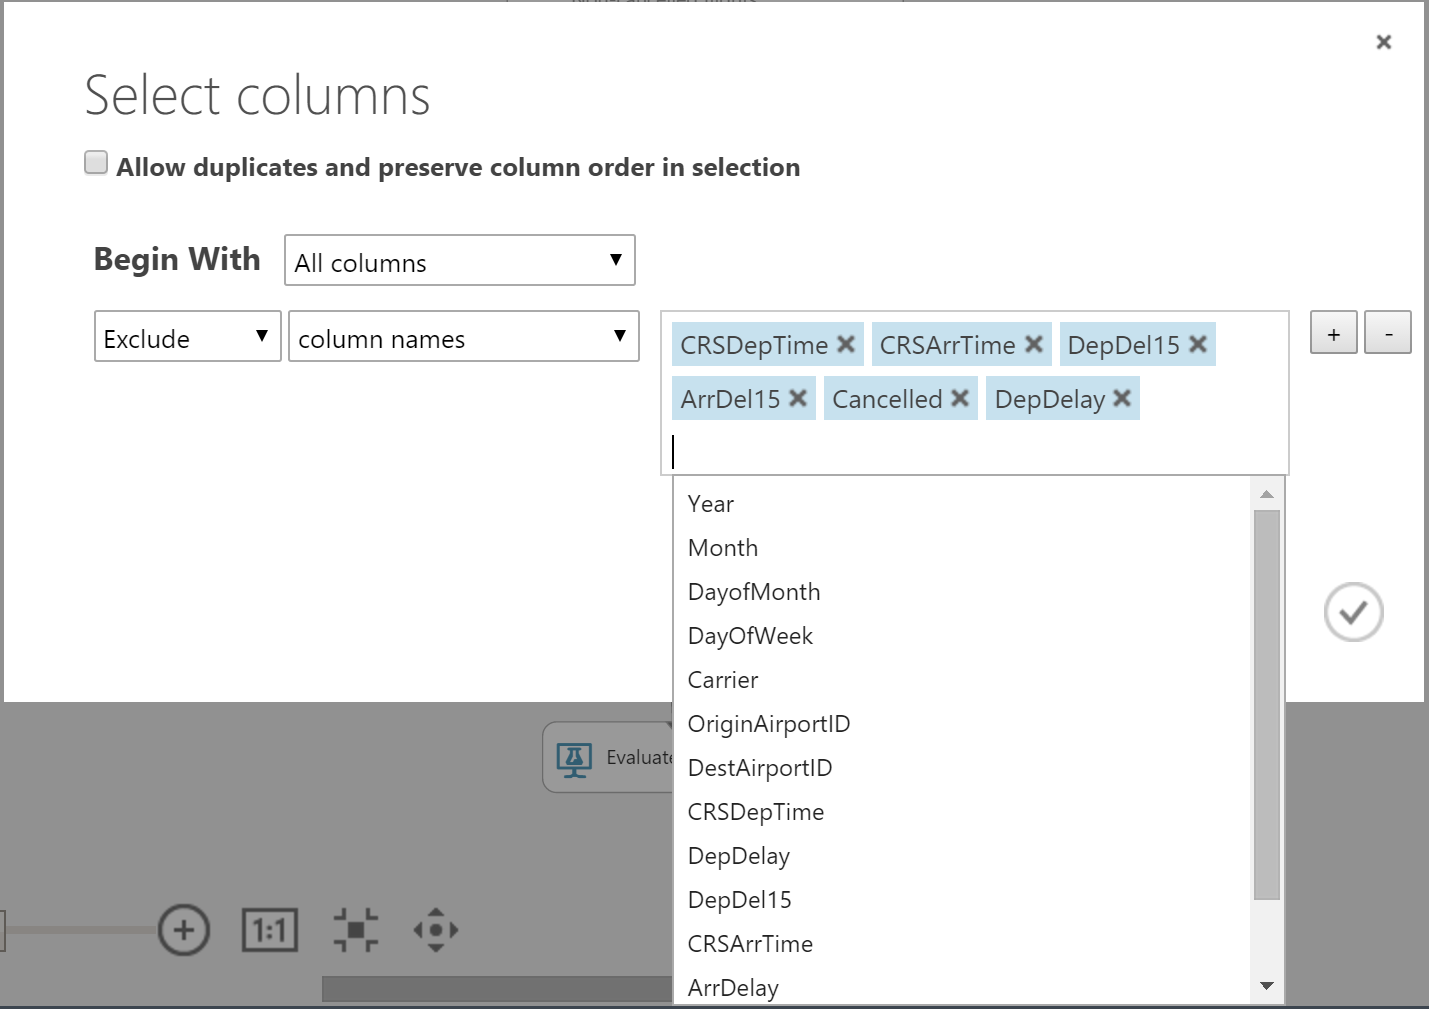
Specify columns to exclude--they aren't used in our model.
Flight Delay Experiment
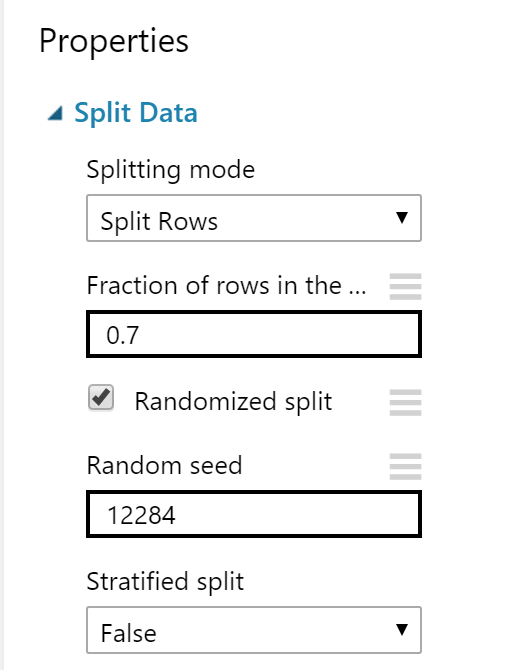
Separate training from test data using another Split Data component.
Flight Delay Experiment
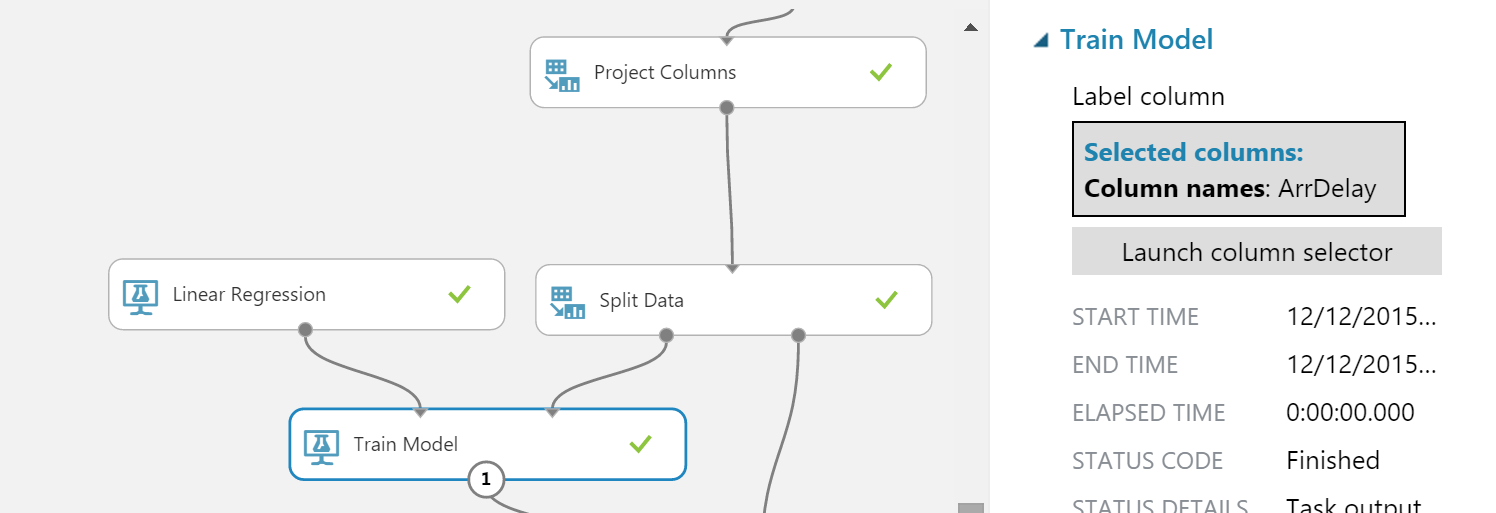
Add and train a Logical Regression model.
Flight Delay Experiment
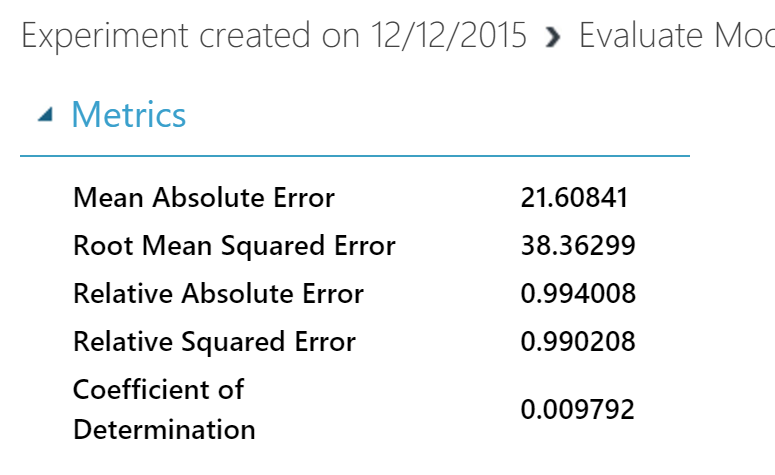
Score and evaluate the model. Results are...less than good: R^2 practically 0.
Azure ML Steps
- Flight Delay Experiment
- Uploading A Data Set
- SQL Saturday Experiment
- SQL Saturday Web Service
- Titanic Survivors
Uploading A Data Set
Using your own data sets is most of the fun in Azure ML. You can learn how the product works using Microsoft-provided data sets, but to provide business value, you need to be able to import your own data sets.
Fortunately, this is very easy to do.
Uploading A Data Set
Demo Time
Scroll down for image-heavy demo.
Uploading A Data Set
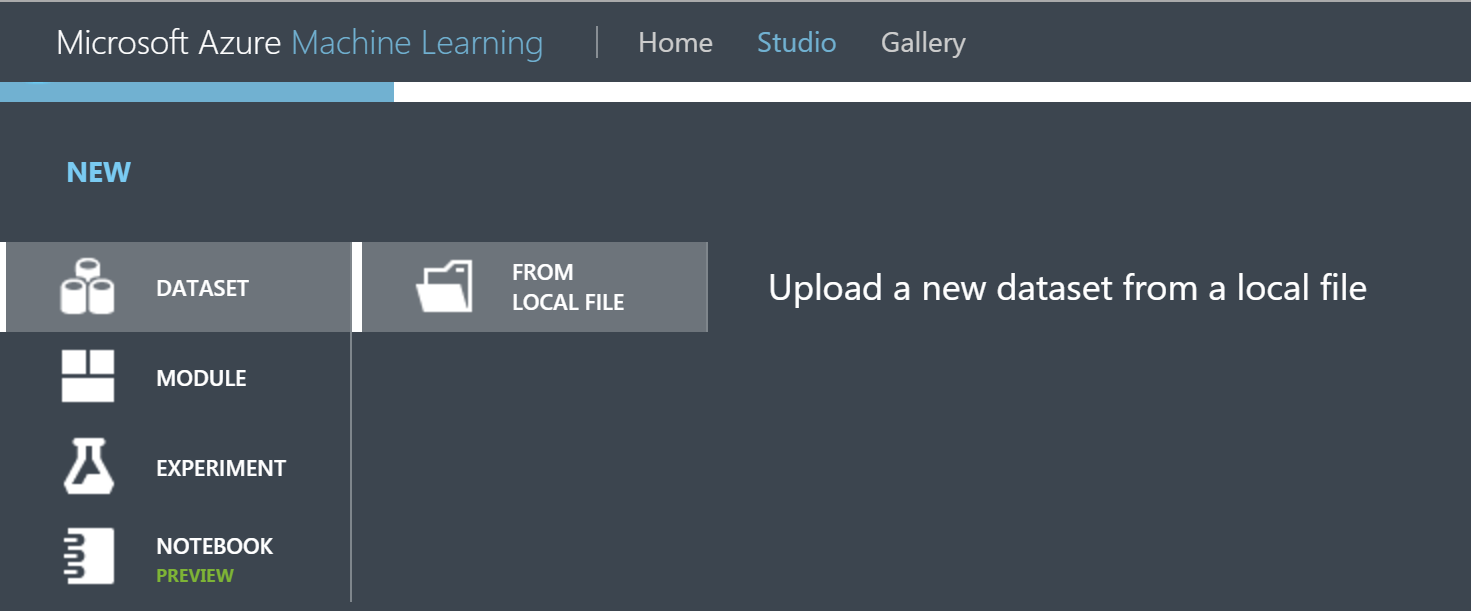
Create a new dataset from a local file.
Uploading A Data Set
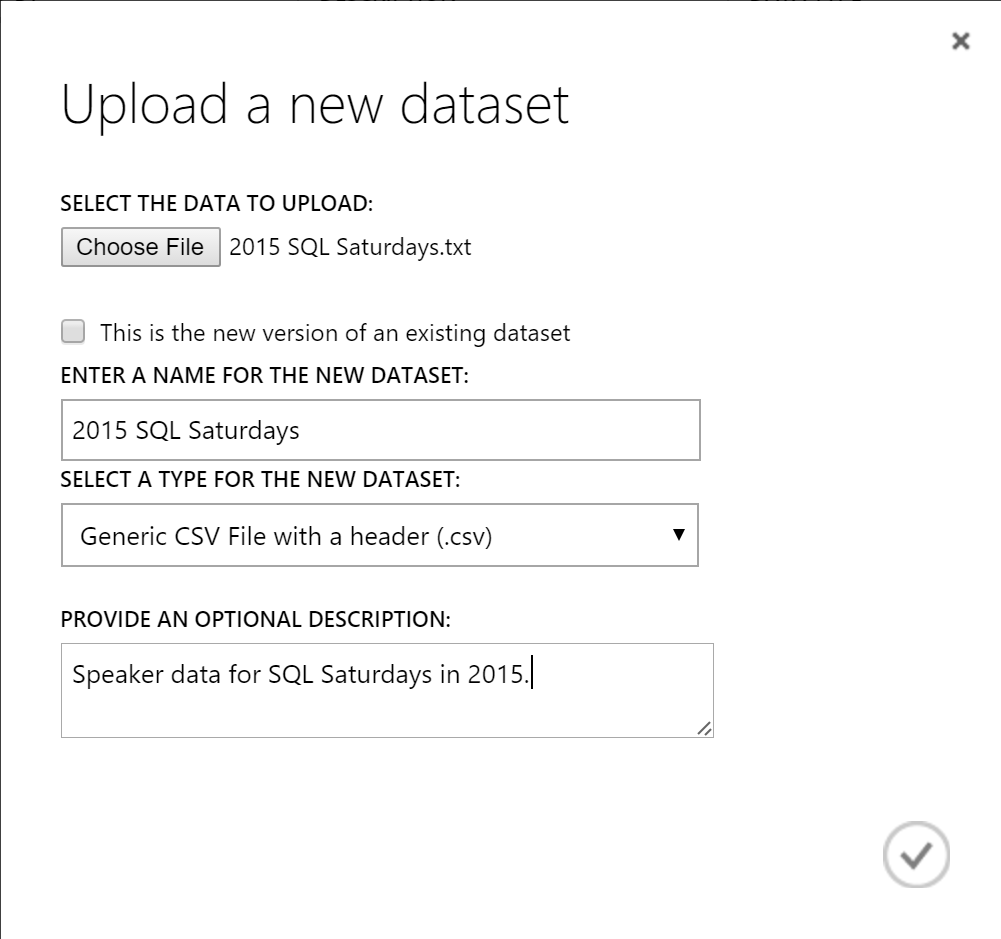
Fill in the modal dialog options.
Uploading A Data Set
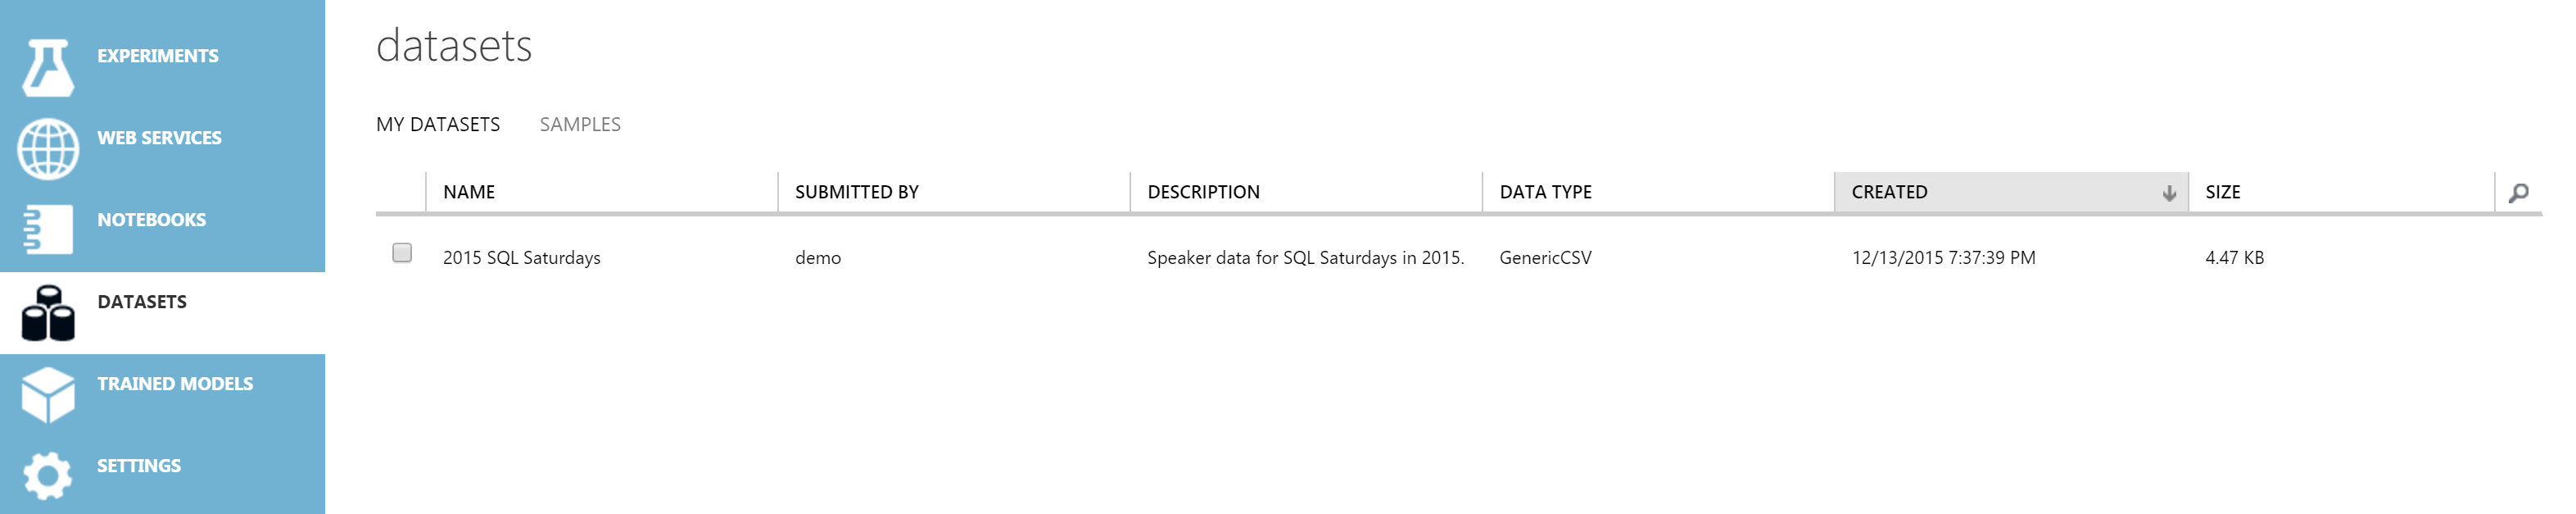
Shortly thereafter, we have a new dataset available for use.
Azure ML Steps
- Flight Delay Experiment
- Uploading A Data Set
- SQL Saturday Experiment
- SQL Saturday Web Service
- Titanic Survivors
SQL Saturday Experiment
SQL Saturday dataset includes:
- Spoke (dependent variable)
- City name (not used in model)
- Region
- Date (not used in model)
- Month
- International (1 if outside U.S.)
- Personal Connection (1 if I know speaker committee)
SQL Saturday Experiment
Basic Steps
- Grab the data set
- Filter out columns we don't want
- Split data into training and test data sets
- Train a linear regression model
- Score and evaluate the linear regression model
SQL Saturday Experiment
Demo Time
Scroll down for image-heavy demo.
SQL Saturday Experiment
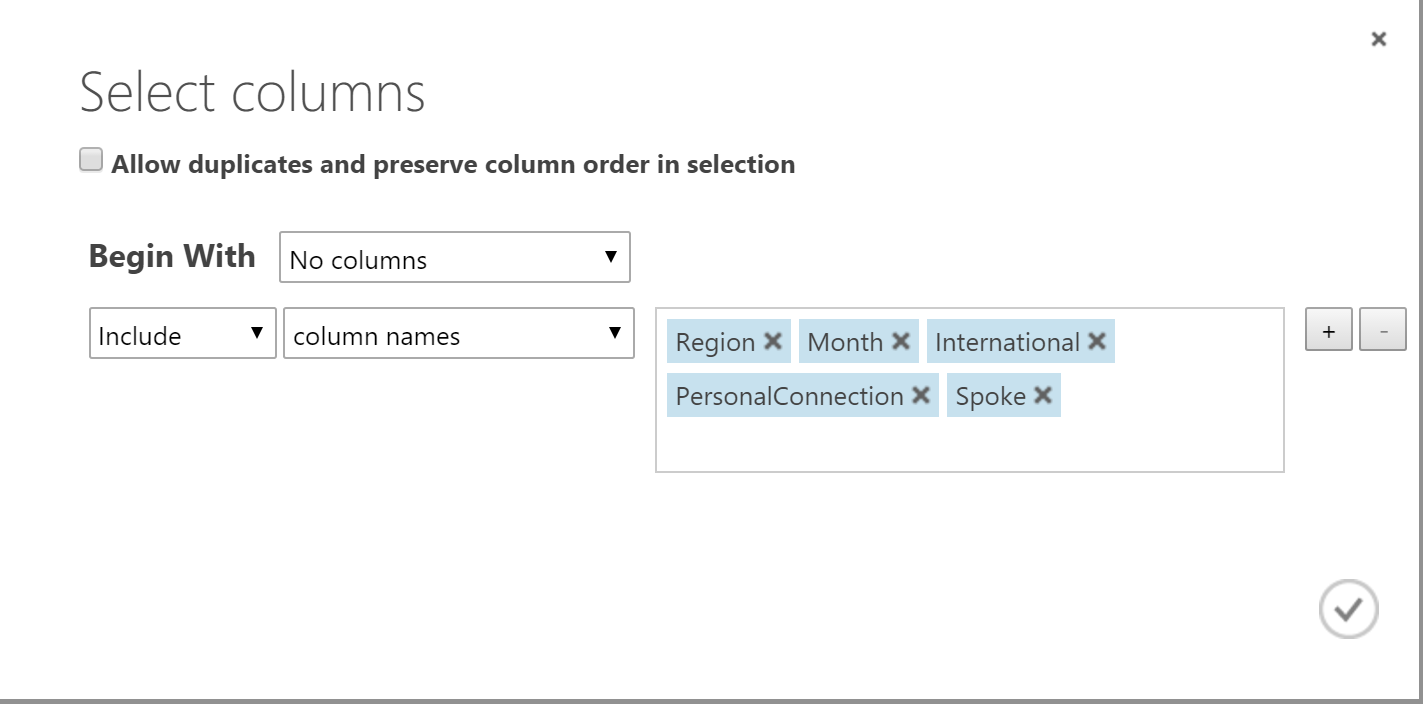
Pull in SQL Saturday dataset and project specific columns.
SQL Saturday Experiment
Build the model.
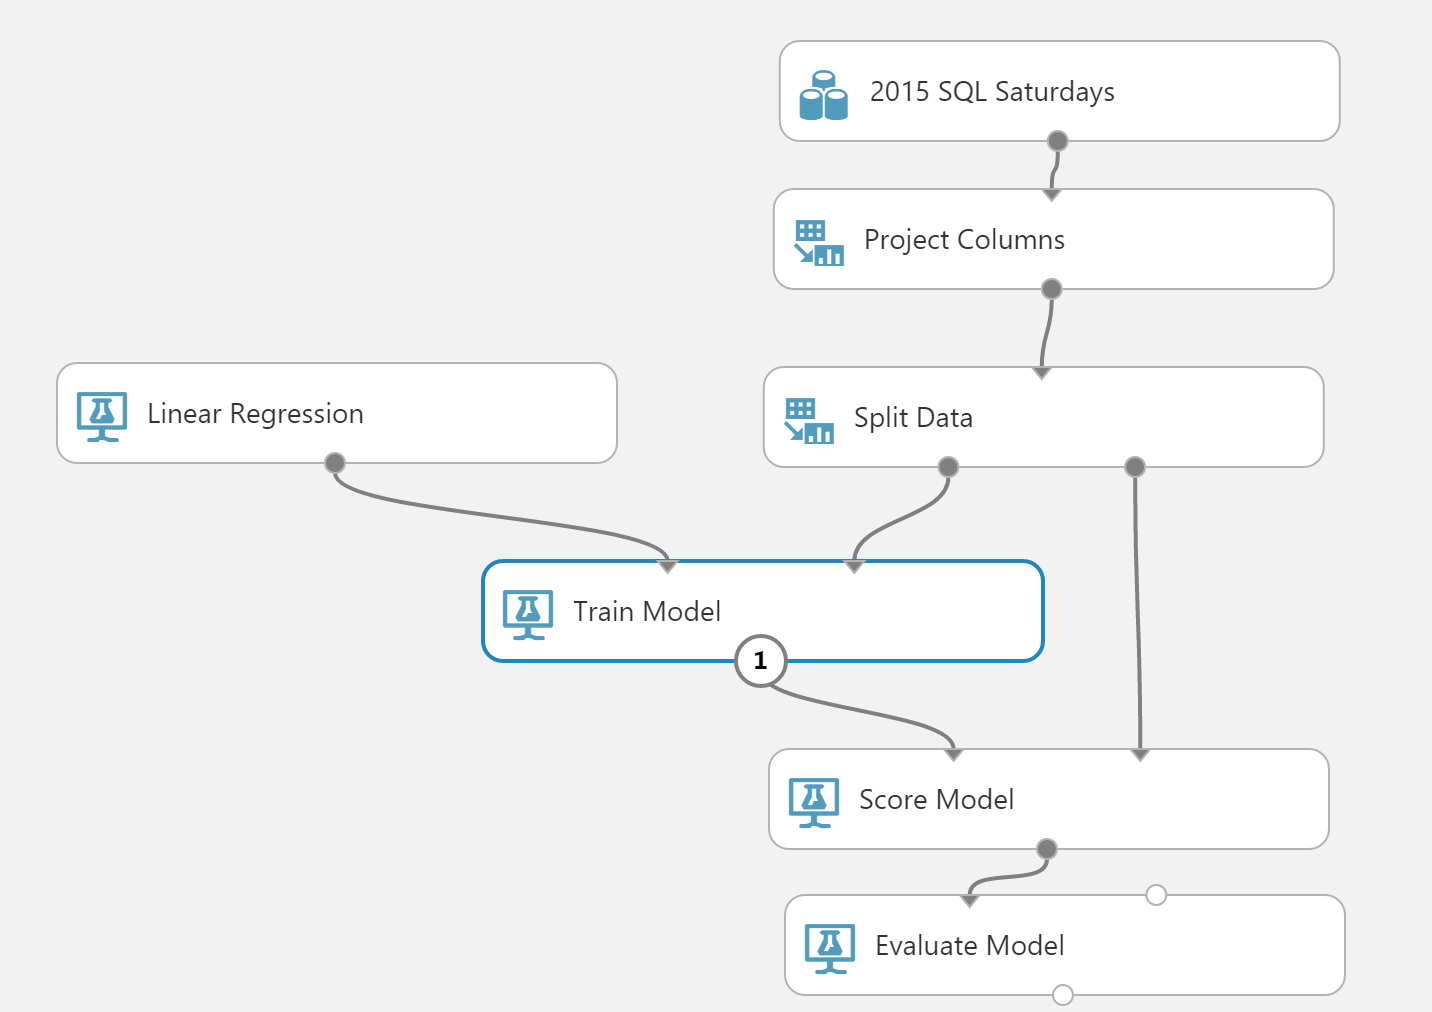
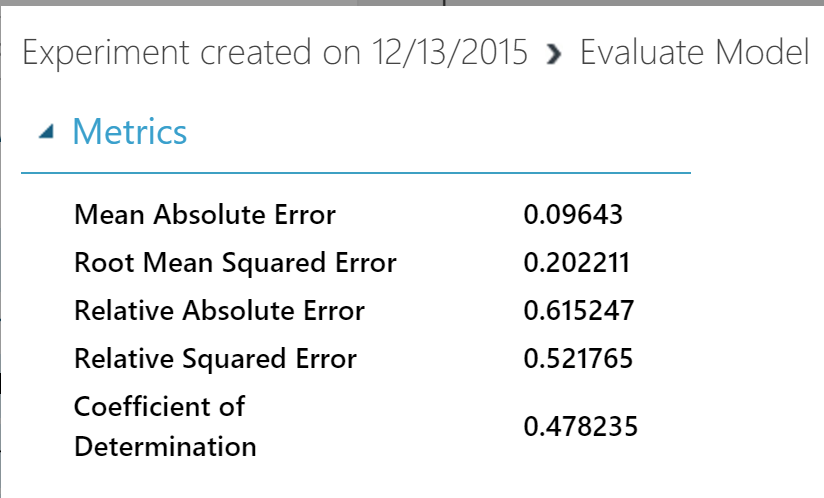
SQL Saturday Experiment
Evaluate the model. R^2 = 0.48, not bad for social science result.
Azure ML Steps
- Flight Delay Experiment
- Uploading A Data Set
- SQL Saturday Experiment
- SQL Saturday Web Service
- Titanic Survivors
SQL Saturday Web Service
Now that we have a functional model, we want to turn this into a web service. Turning this into a web service will allow us to call the service to predict whether I am likely to speak at future events.
SQL Saturday Web Service
Demo Time
Scroll down for image-heavy demo.
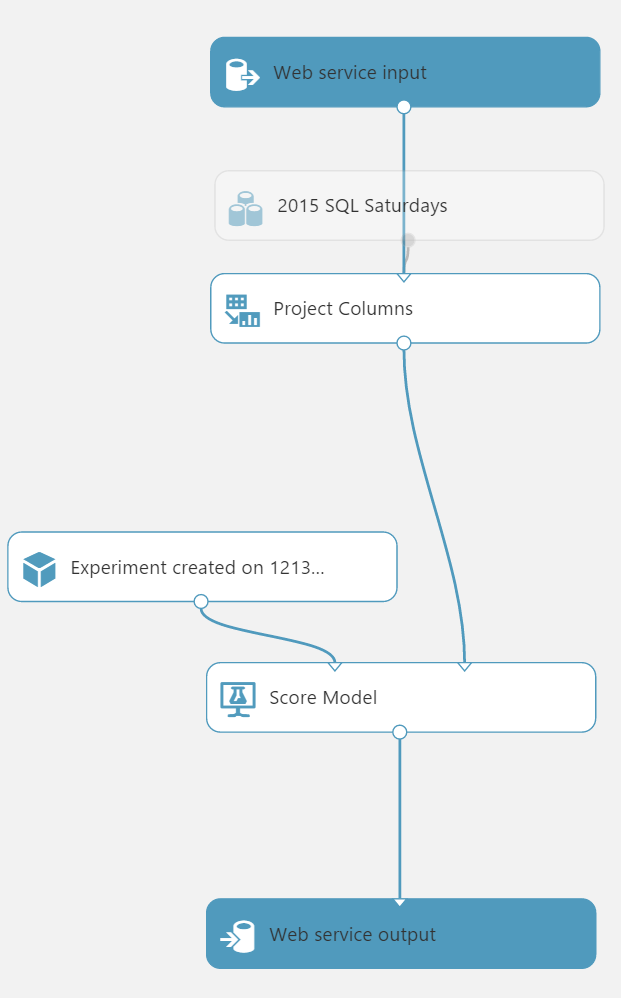
SQL Saturday Web Service
Click the "Set Up Web Service" button and pick Predictive Web service.

SQL Saturday Web Service
Check the predictive experiment tab and then click Deploy Web Service.
SQL Saturday Web Service
Test the web service.
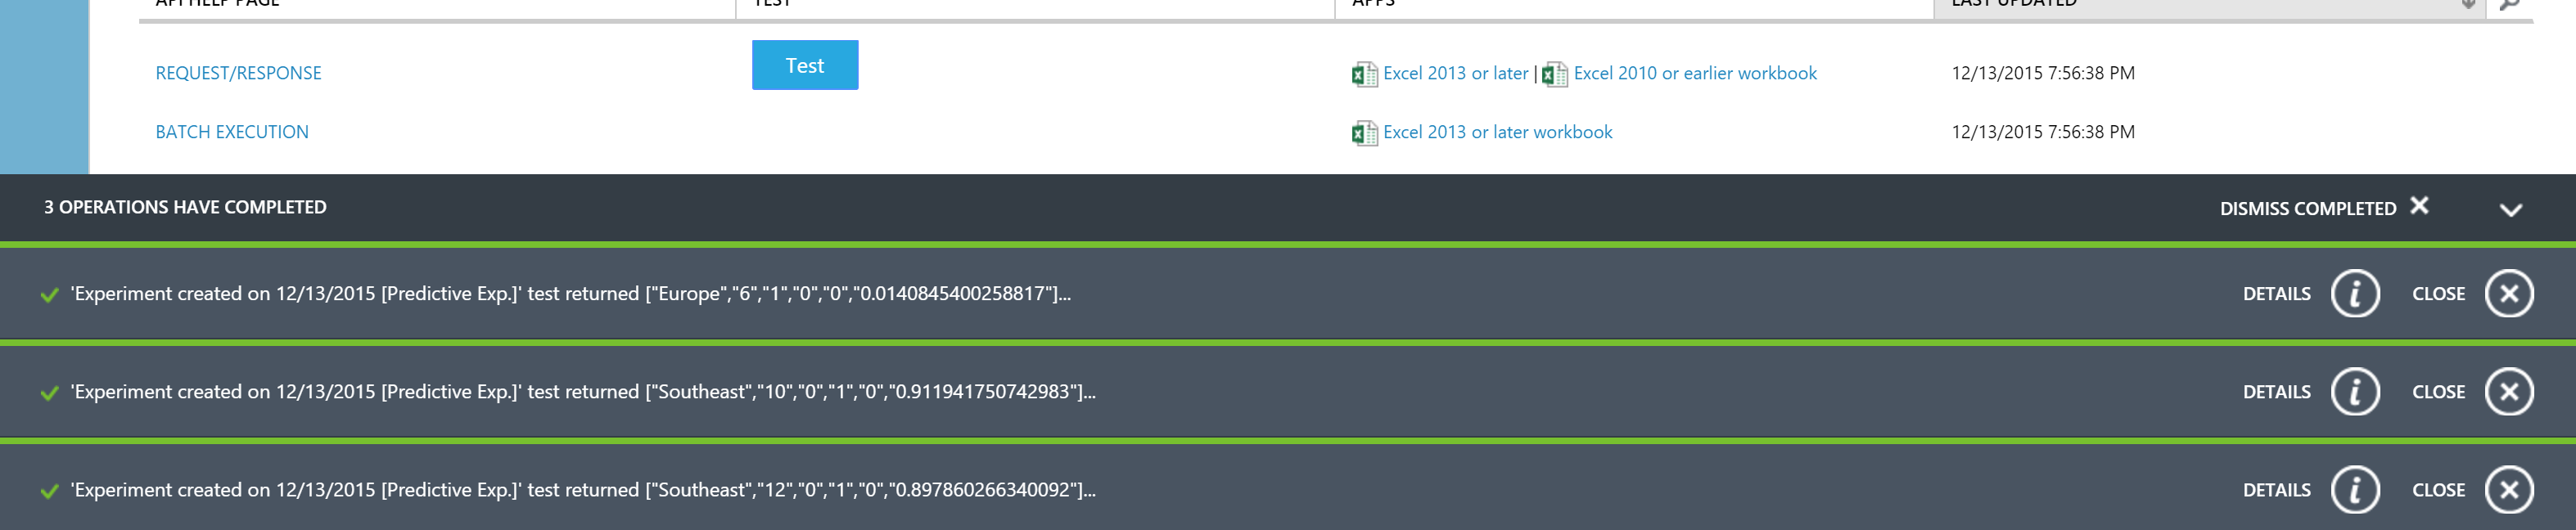
SQL Saturday Web Service
Test Results
| City | Month | Know SC? | Expected | Actual |
| Cleveland | 02 | 1 | ~1 | 0.73 |
| Baltimore | 08 | 1 | ~0.5 | 0.52 |
| Dallas | 05 | 0 | 0 | 0.009 |
| Kansas City | 10 | 1 | ~0.5 | 0.67 |
| Berlin | 06 | 0 | 0 | 0.01 |
| Raleigh | 10 | 1 | ~1 | 0.91 |
| Raleigh | 12 | 1 | ~1 | 0.898 |
Azure ML Steps
- Flight Delay Experiment
- Uploading A Data Set
- SQL Saturday Experiment
- SQL Saturday Web Service
- Titanic Survivors
Titanic Survivors
This comes from a Kaggle competition. The training set includes:
- Survived (dependent variable)
- Passenger Class
- Name, Sex, Age
- Number of siblings + spouse aboard
- Number of parents + children aboard
- Fare paid
- City of embarkment
Titanic Survivors
Basic Steps
- Grab the data set
- Clean up the data set: fix data types, improve column names, clean missing data
- Filter out columns we don't want
- Split data into training and test data sets
- Train a classification model
- Score and evaluate the classification model
Titanic Survivors
Thoughts On Modeling
Picking the right model is critical to coming up with something which has predictive value. Here are our modeling considerations:
- Survived is our sole dependent variable.
- We care more about predicting the dependent variable than determining weights on the independent variables.
- Survived is categorical data--it takes values of 0 or 1. It is NOT a probability indicator.
Given these, we want to choose a two-class model. Choosing a decision tree, forest, or jungle seems to be a good starting point.
Titanic Survivors
Demo Time
Scroll down for image-heavy demo.
Titanic Survivors
Full model:
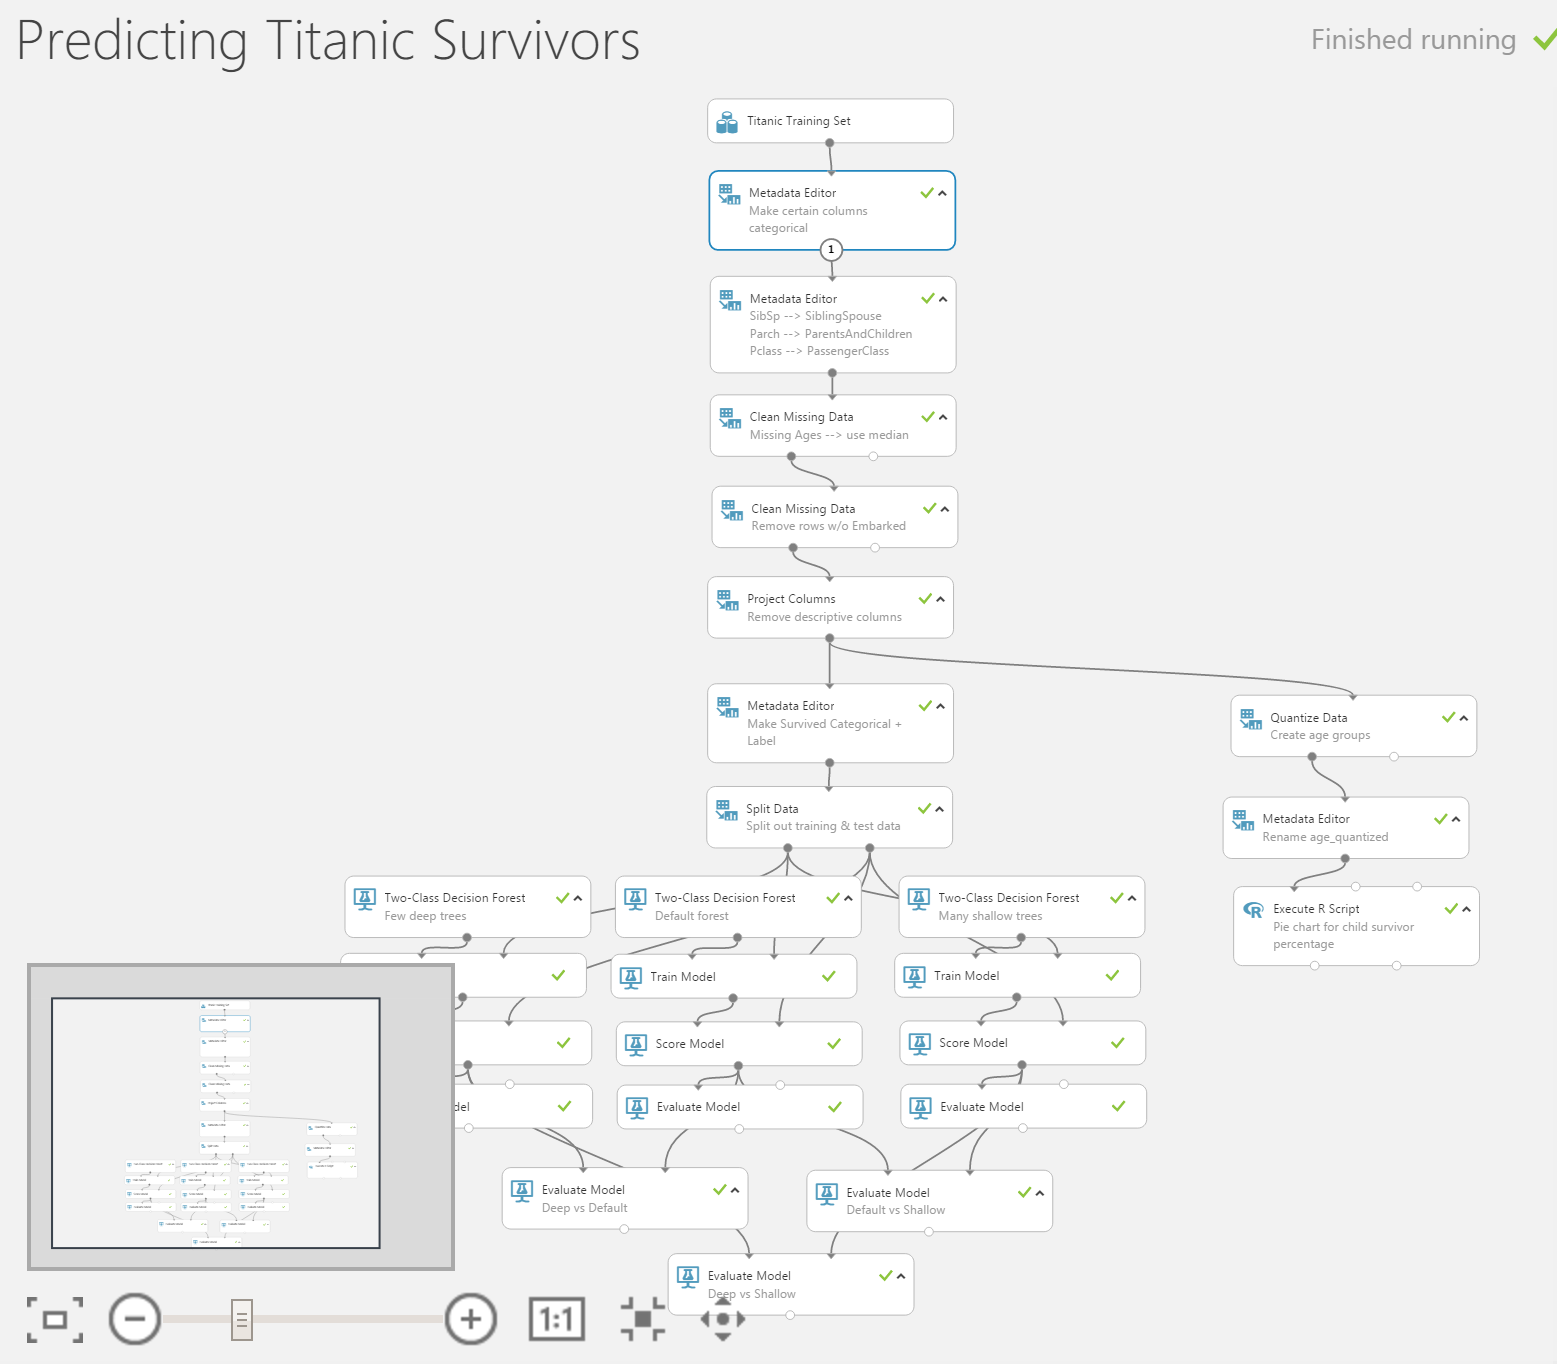
Titanic Survivors
Pull in Titanic dataset. Data visualization:
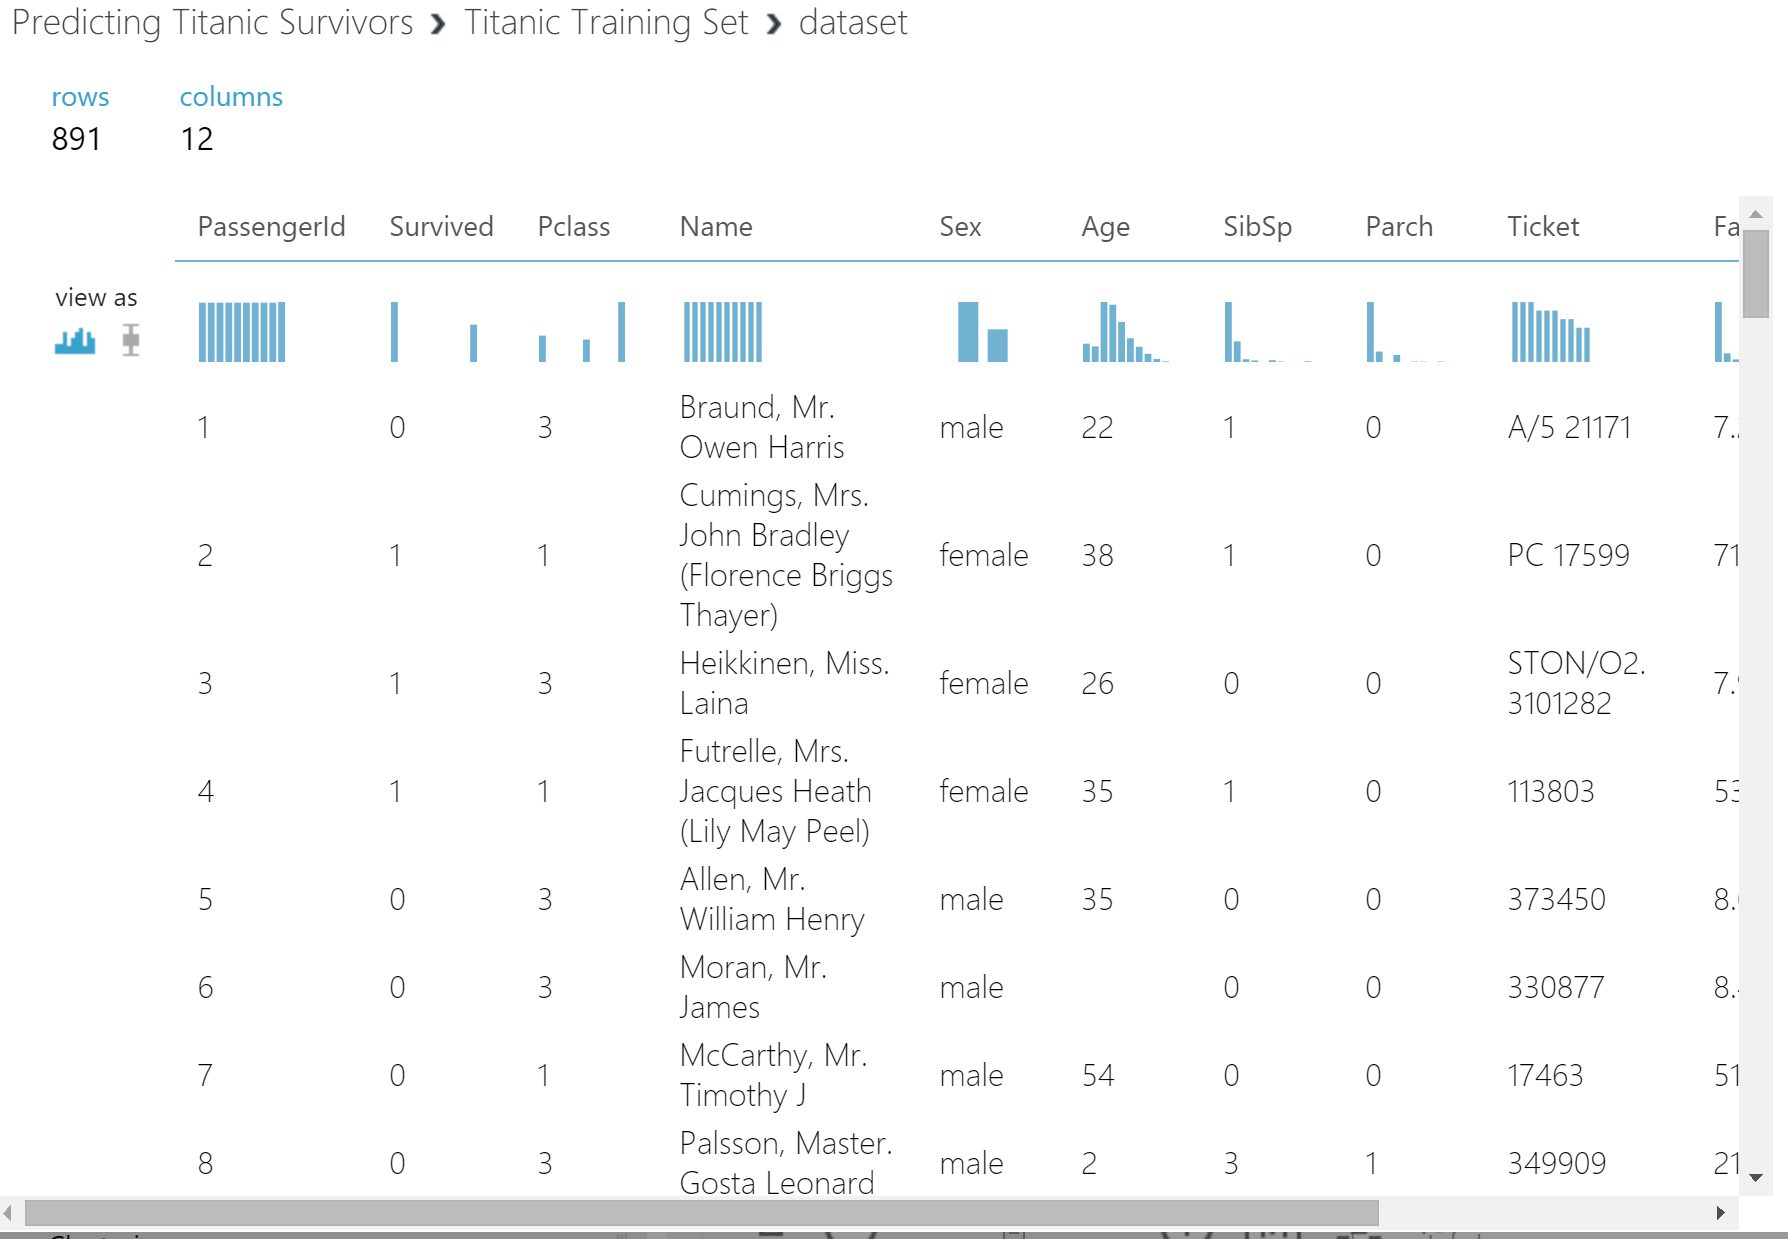
Titanic Survivors
Make certain columns categorical data.
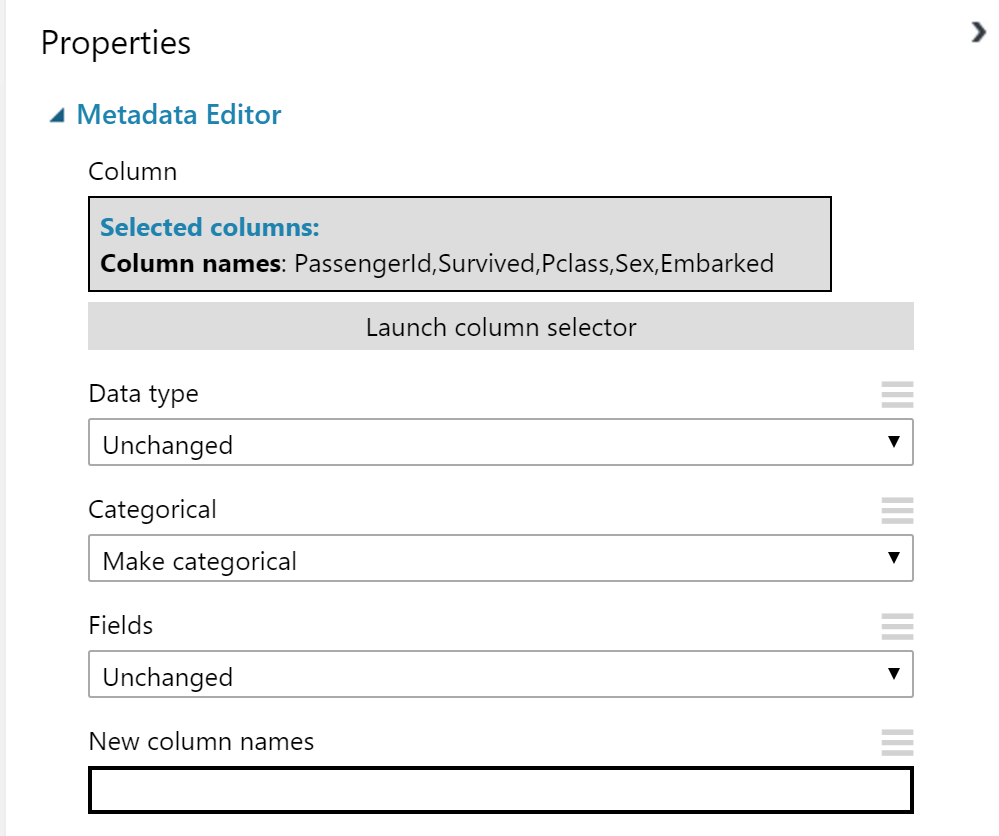
Titanic Survivors
Rename columns to make more sense.
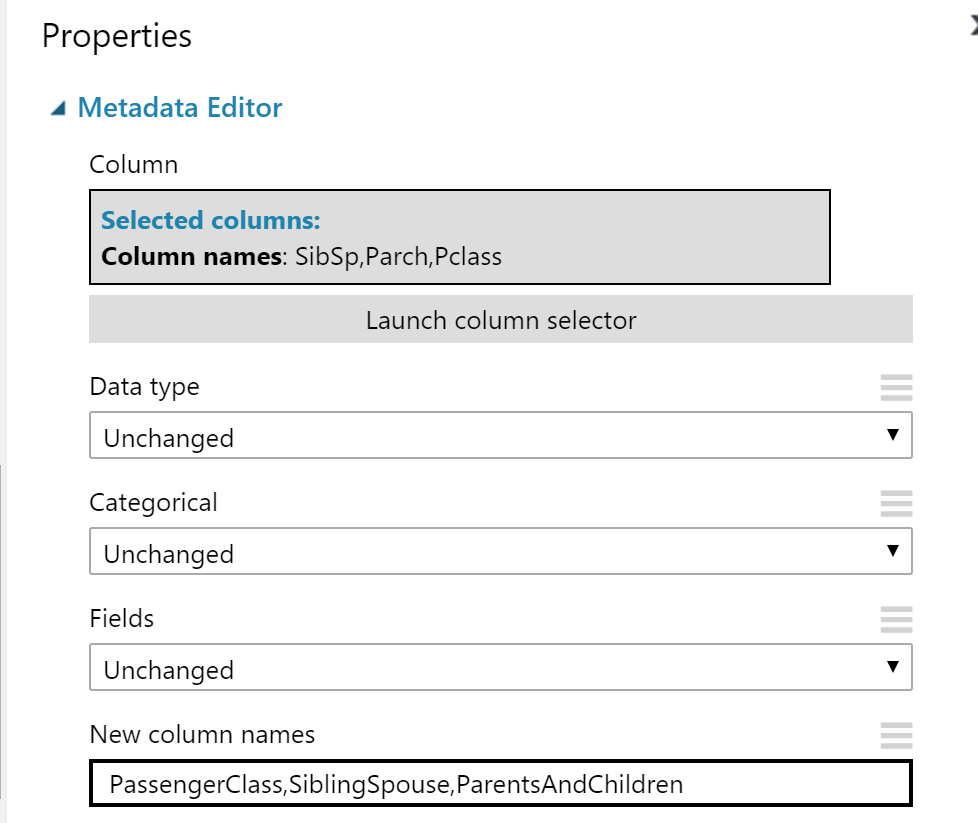
Titanic Survivors
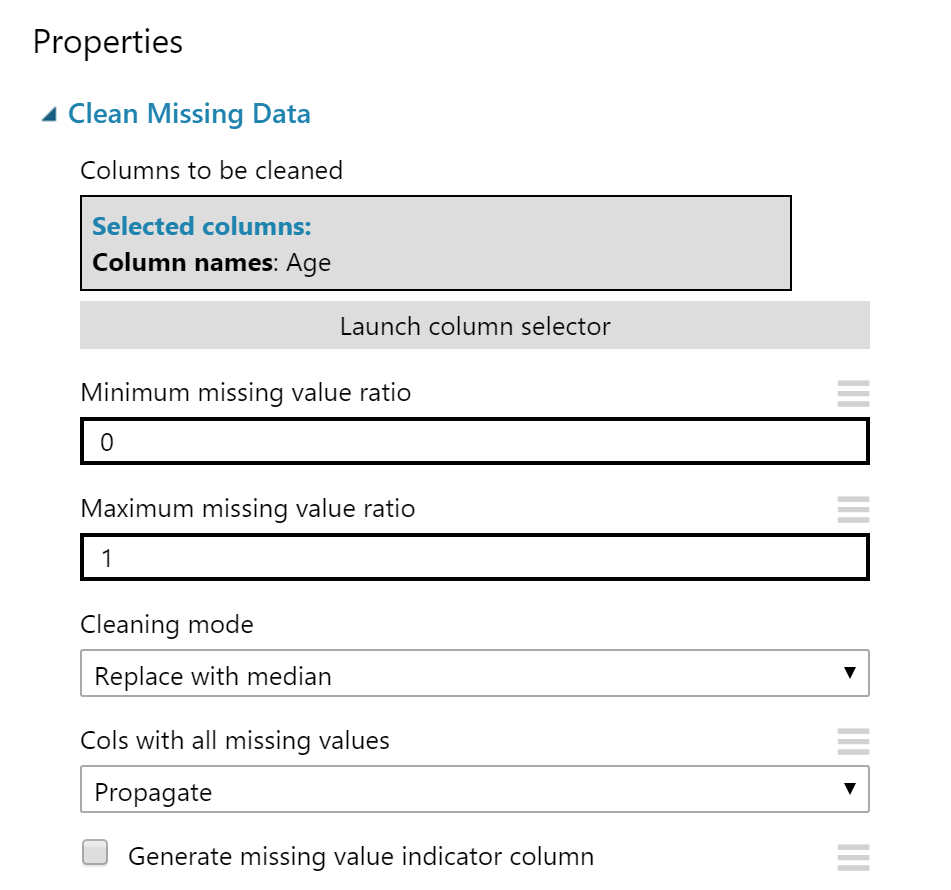
Set missing Age values to the median.
Titanic Survivors
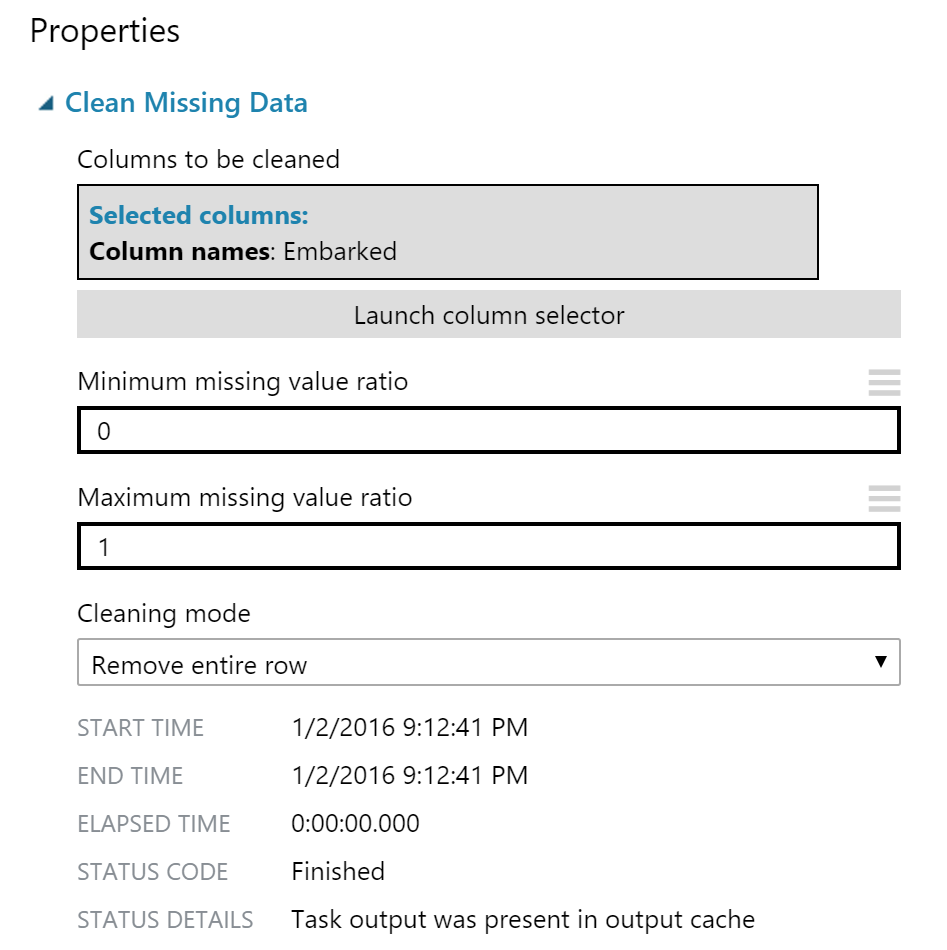
Remove rows without Embarked values (2 rows total).
Titanic Survivors
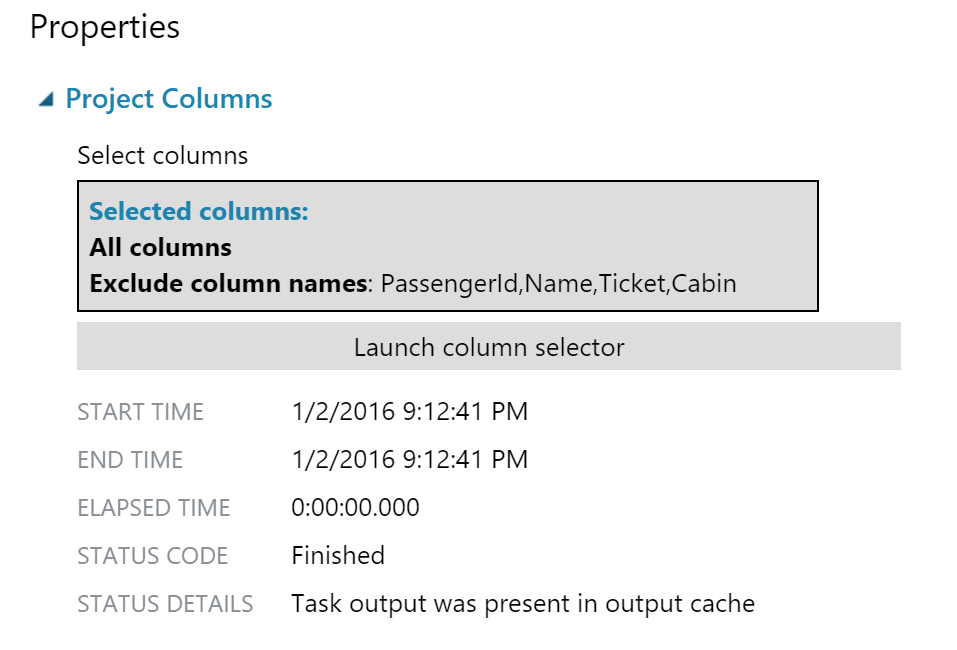
Remove unnecessary columns from model.
Titanic Survivors
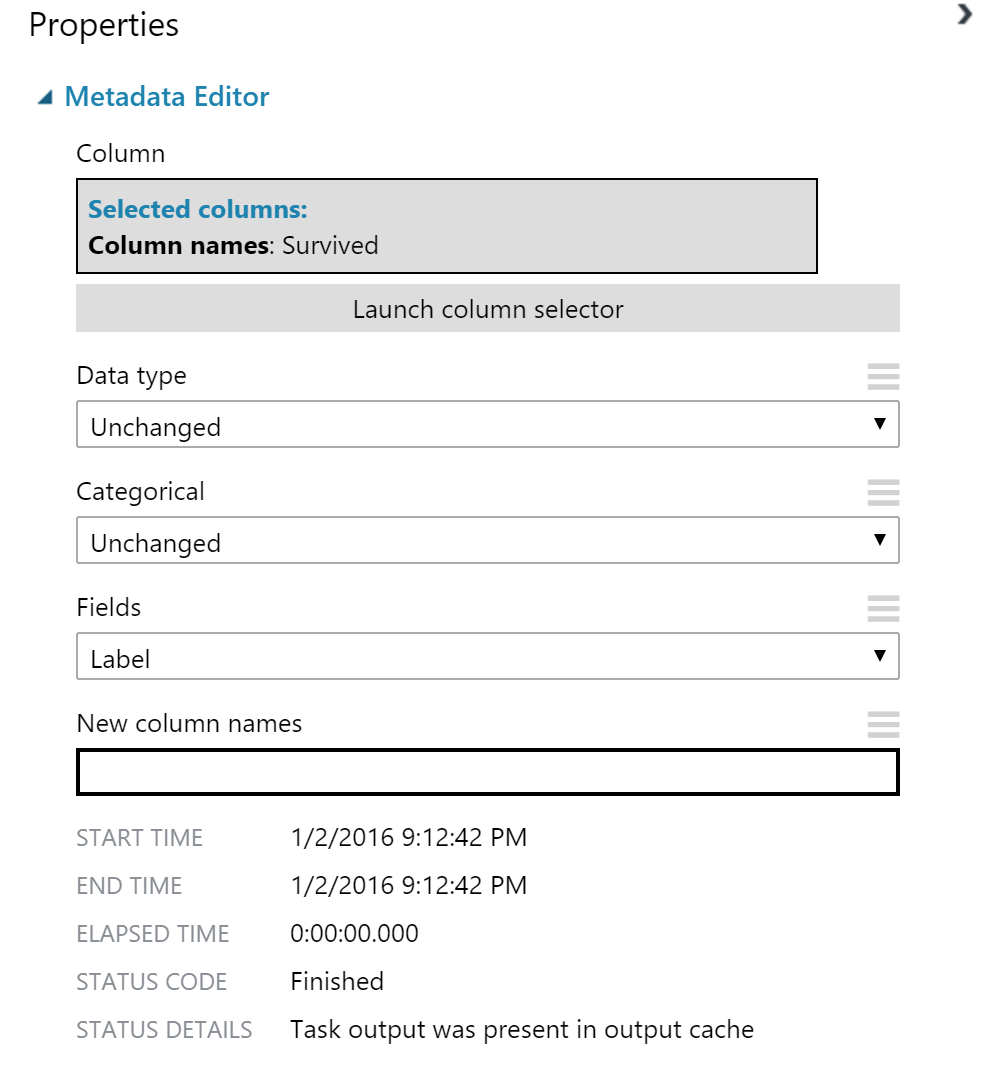
Make Survived Categorical + Label.
Titanic Survivors
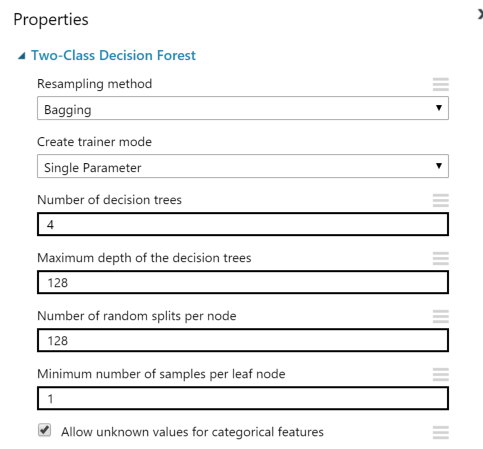
Compare decision forest options. Ex: few, deep trees.
Titanic Survivors
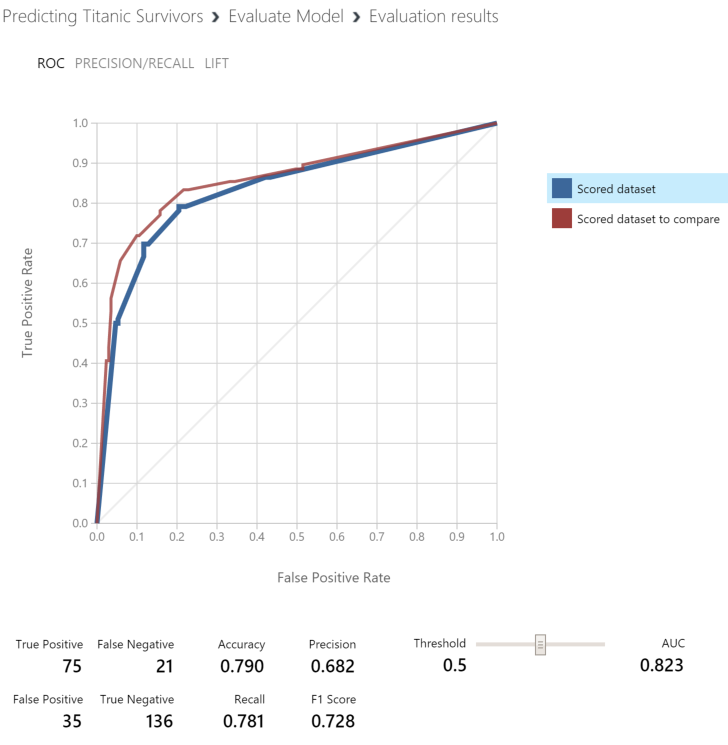
Compare the models. The best model had AUC of .855, pretty decent.
Titanic Survivors
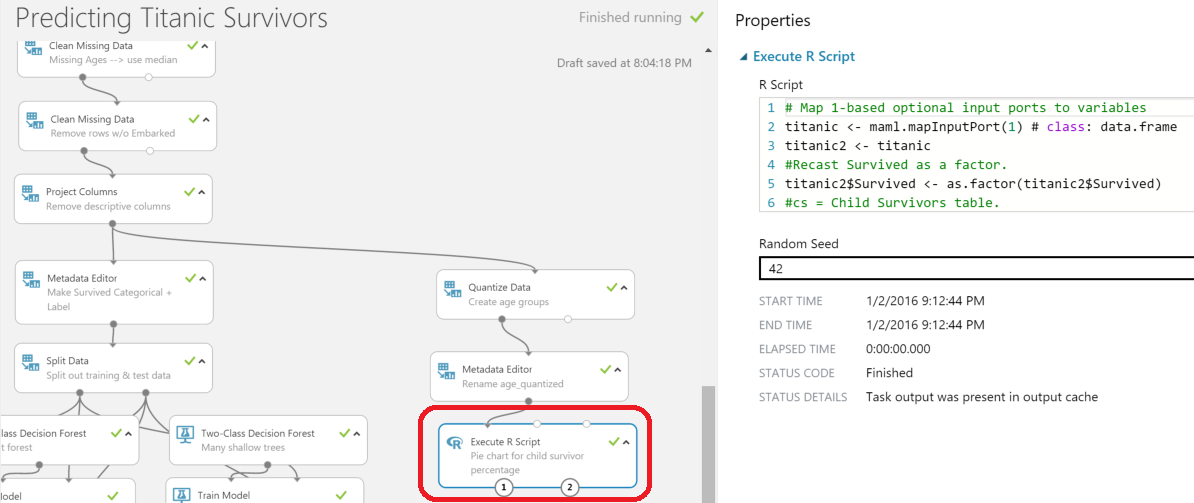
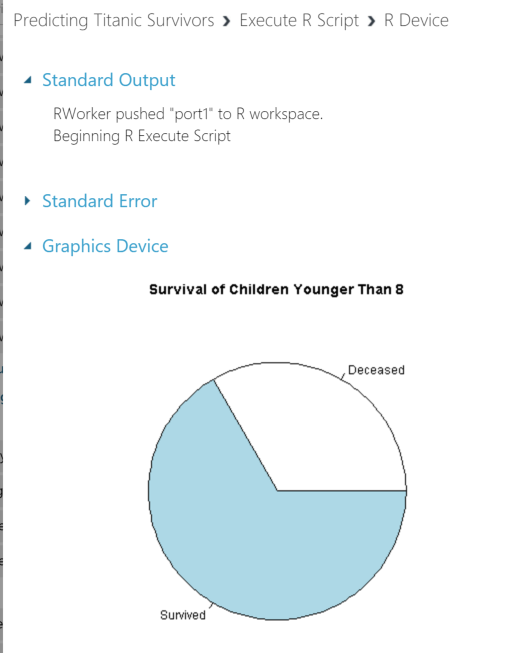
Bonus work: integrate with R!
Titanic Survivors
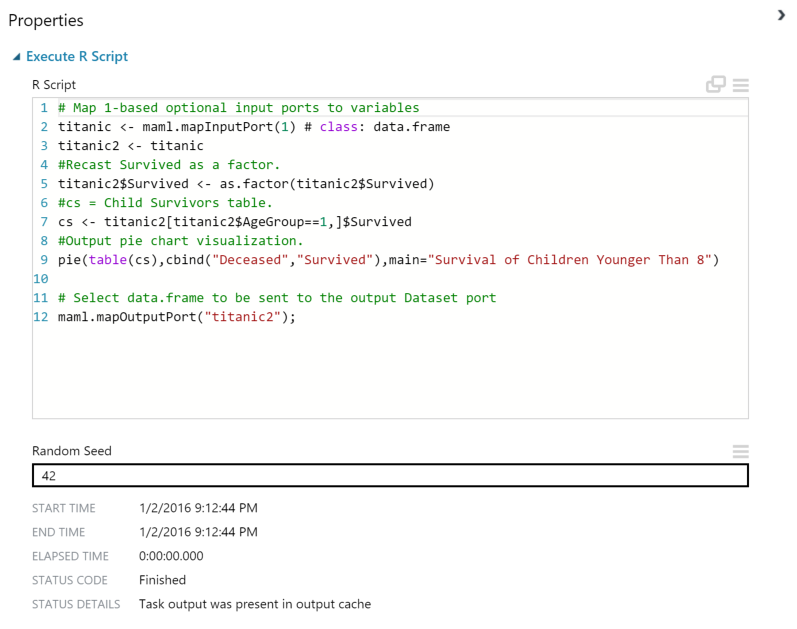
R scripting is easy (though no debugger).
Titanic Survivors
This lets us include multiple visualizations.
Wrapping Up
Azure ML won't make you a data scientist, but it does offer a suite of powerful tools for data specialists.
To learn more, go here: http://CSmore.info/on/azureml
And for help, contact me: feasel@catallaxyservices.com | @feaselkl